Please utilize your web browser's ZOOM feature to
manually optimize the display of this webpage to
your screen resolution

MultiGran: a computational model that tracks
multiple granulomas within the lung
|
an on-line supplement for A computational model tracks whole-lung Mycobacterium tuberculosis infection and predicts factors that inhibit dissemination |
[ Kirschner Lab Time-Lapse Simulations Homepage ]
|
Timothy Wessler, Louis R. Joslyn, H. Jacob Borish, Hannah P. Gideon, JoAnne L. Flynn, Denise E. Kirschner, Jennifer J. Linderman,
A computational model tracks whole-lung Mycobacterium tuberculosis infection and predicts factors that inhibit dissemination,
Online 24 July 2019, biorxiv.org, (accepted at PLoS Computational Biology)
DOI:
10.1101/713701,
PMID: (pending),
PMCID: (pending),
|
|
| Supplementary 1: | Granuloma_CFU_counts.csv - Table of CFU values for 623 granulomas from 38 NHP |
| Supplementary 2: | TableAccompanySpreadsheet.png - We analyzed Granuloma_CFU_counts.csv to determine how many granulomas are found in each lung. We grouped granulomas by nonhuman primate ID, and counted how many granulomas were found in each lobe--left lower lobe (LLL); left middle lobe (LML); left upper lobe (LUL); right lower lobe (LLL); right middle lobe (LML); right upper lobe (LUL); and accessory lobe (ACC), which is a part of the right lung. The more-infected lung is considered the lung with more granulomas in it. |
| Supplementary 3: | AlgorithmForFindingGranulomaClusters.pdf - Document which describes the algorithm for finding the granuloma clusters |
| Supplementary 4: | VirtualNHPMatches_178_180_181.pdf - Similar to Figure 7 in the text, but these are virtual NHPs similar to NHP IDs 178, 180, and 181 from Martin et al. Included are CFUs of each (clustered) granuloma within each NHP next to its corresponding virtual NHP, as well as CFUs of each (clustered) granuloma within each NHP on top of a time-course plot for its corresponding virtual NHP. |
| Supplementary 5: | CFUof200InSilicoNHP.pdf - Plots for each of the 200 virtual NHP we simulated after calibration. Each plot includes the CFU of each individual granuloma (not grouped into granuloma clusters) formed in that particular NHP. |
 Movie 1 |
 Movie 2 |
|
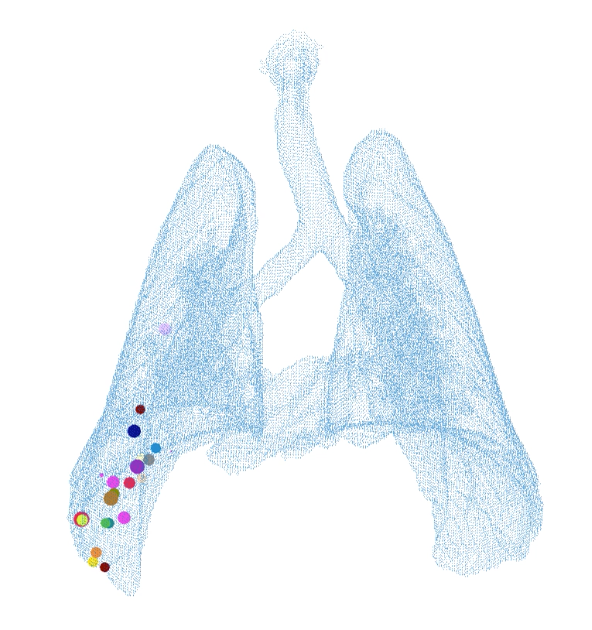
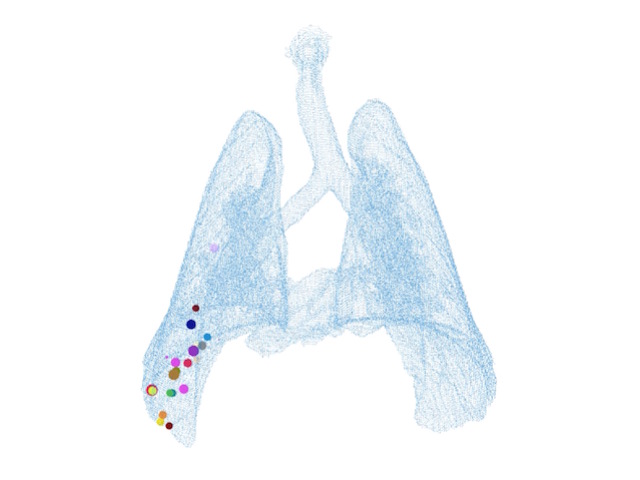
A single in silico simulation across 250 days following infection (anterior view)
plotted over a data grid taken from PET/CT images of a single NHP. Granulomas are
located in 3D space wherein each circle of a single color represents a granuloma with
a single Mtb barcode ID. The circle shown as a pie chart represents a granuloma cluster
with two unique Mtb barcode IDs. Inoculation was in the lower right lung (bottom left
in image of simulation). Granulomas found in upper lung region result from non-local
dissemination within the simulation. |
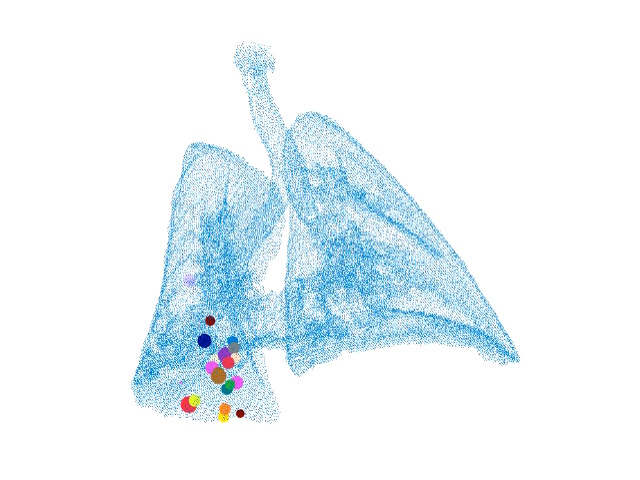
A single in silico simulation across 250 days following infection (same as Movie 1,
just shown in posterior-lateral view) plotted over a data grid taken from PET/CT images
of a single NHP. Granulomas are located in 3D space wherein each circle of a single
color represents a granuloma with a single Mtb barcode ID. The circle shown as a pie
chart represents a granuloma cluster with two unique Mtb barcode IDs. Inoculation was
in the lower right lung (bottom left in image of simulation). Granulomas found in upper
lung region result from non-local dissemination within the simulation. |
 Movie 3 |
|
|
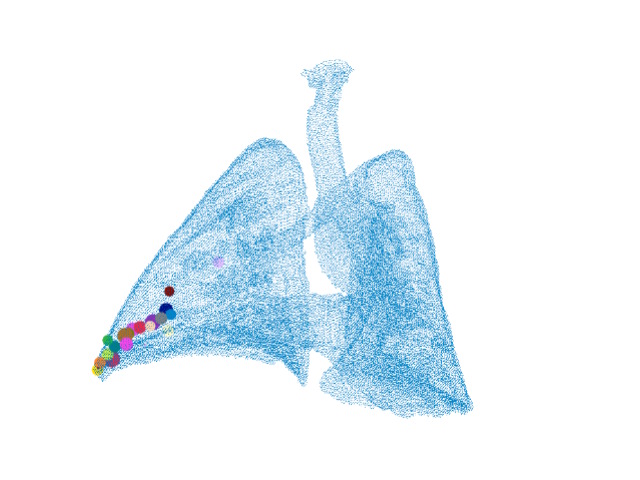
A single in silico simulation across 250 days following infection (same as Movie 1/2, just
shown in opposite posterior-lateral view) plotted over a data grid taken from PET/CT images
of a single NHP. Granulomas are located in 3D space wherein each circle of a single color
represents a granuloma with a single Mtb barcode ID. The circle shown as a pie chart represents
a granuloma cluster with two unique Mtb barcode IDs. Inoculation was in the lower right lung
(bottom left in image of simulation). Granulomas found in upper lung region result from non-local
dissemination within the simulation. |
| [ Kirschner Lab Time-Lapse Simulations Homepage ] |