Jennifer J. Linderman, Thomas Riggs, Manjusha Pande, Mark Miller, Simeone Marino,
and Denise E. Kirschner,
Characterizing the Dynamics of CD4+ T Cell Priming within
a Lymph Node.
Journal of Immunology, 2010, 184: pp 2873-2885,
DOI: 10.4049/jimmunol.0903117,
PMID: 20154206,
PMCID: 3153313

|
To play the movie, click on the 'play' button above
Time lapse simulation of T cell and dendritic cell (DC) movement in the
lymph node (LN). Full LN T-zone is represented by a 200 X 25 unit grid; basic unit
of the grid is a 5 micron X 5 micron square. Each grid unit can hold up to 4
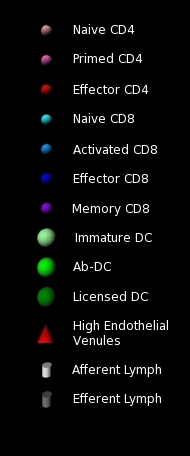
T cells or one DC. T cells are represented by smaller spheres, larger
spheres represent DCs; colors represent different cell types as described in
the key. Time is shown at the top of the grid, in hours since the beginning
of the simulation. DCs enter via afferent lymphatics (AL) represented by
white cylinders at the top of the grid. T cells enter via HEV (not shown)
and leave via efferent lymphatics (EL) represented by gray cylinders at the
bottom of the grid. DCs usually spend their remaining lifespan in the lymph
node. Some views show the entire grid while others show a close-up. A, B, C:
Simulations of acute infection with cognate T cell to total T cells ratio
of 1:300 - (A) Zoom Level 2 view, (B) Zoom Level 1 view, and (C) normal view of the grid. Simulations of acute infection with cognate T cell to total T cells ratio of 1:3000 - (D) Zoom Level 2 view, (E) Zoom Level 1 view, and (F) normal view of the grid.
|

|
Right click or CTRL-click on MOV icon,
select "Save Link As" or "Save Target As"
to download the archived MOV movie file version of
time-lapse simulations
|
To extract the MOV movie from the archive, download the archive to your Mac or Windows desktop,
double-click on them, and follow the on-screen instructions.
To extract on Linux, Unix, BSD, etc... use the command in a shell 'unzip (filename.zip)' or a desktop extraction utility
|
|
|
|