Please utilize your web browser's ZOOM feature to
manually optimize the display of this webpage to
your screen resolution

TumorSim - an agent-based model of Small Cell Lung Cancer tumor formation
|
an on-line supplement for A comparison and contrast of lung tumor and Tuberculosis granuloma mechanisms driving lesion formation and heterogeneity |
[ Kirschner Lab Time-Lapse Simulations Homepage ]
Supplementary Material (pdf)
Appendix A - TumorSim ODD model description (pdf)
|
Overview: Lung cancer is the leading cause of cancer-related morality. Among lung cancers, small-cell lung cancer (SCLC) is an aggressive subtype with <20% two-year survival. A variety of immune cells respond during SCLC tumor formation. Some of these cells inhibit tumor growth while others permit immune escape, leading to unchallenged proliferation of cancerous cells. Many of these cells play dual roles based on relative position and interaction and can activate, de-activate and re-polarize to different pro-and anti-tumor states within the tumor microenvironment. To untangle the web of interactions at play, we introduce TumorSim. TumorSim is an agent-based model that captures the escape phase of SCLC tumor formation, using a well-established approach for studying complex and spatially-sensitive cell-cell interactions. TumorSim incorporates the most influential cellular drivers of tumor resolution and captures a spectrum of tumor outcomes ranging from elimination-phase regression, through tumor dormancy, to immune-cold tumor progression, shown in the videos below. Supplemental Videos: The following videos (S1-S3) show three representative simulated SCLC tumors over 14 days. Video S1 shows a virtual dormant tumor, video S2 shows a virtual progressing tumor, and video S3 shows a virtual regressing tumor. These are the same tumors described in Supplemental Figures S5-S6.
|
Parameter value versus Tumor Outcome scatterplots: The following scatterplots (Figures A-E) show significant parameter values (horizontal axes) plotted against the five Tumor outcomes shown in Figure 2 (C-G). As this is the first iteration of TumorSim, we present these scatterplots to show monotonicity between parameter values and model outcomes to satisfy the assumptions of the Partial Rank Correlation Coefficients method. (See Marino et al., doi: 10.1016/j.jtbi.2008.04.011) |
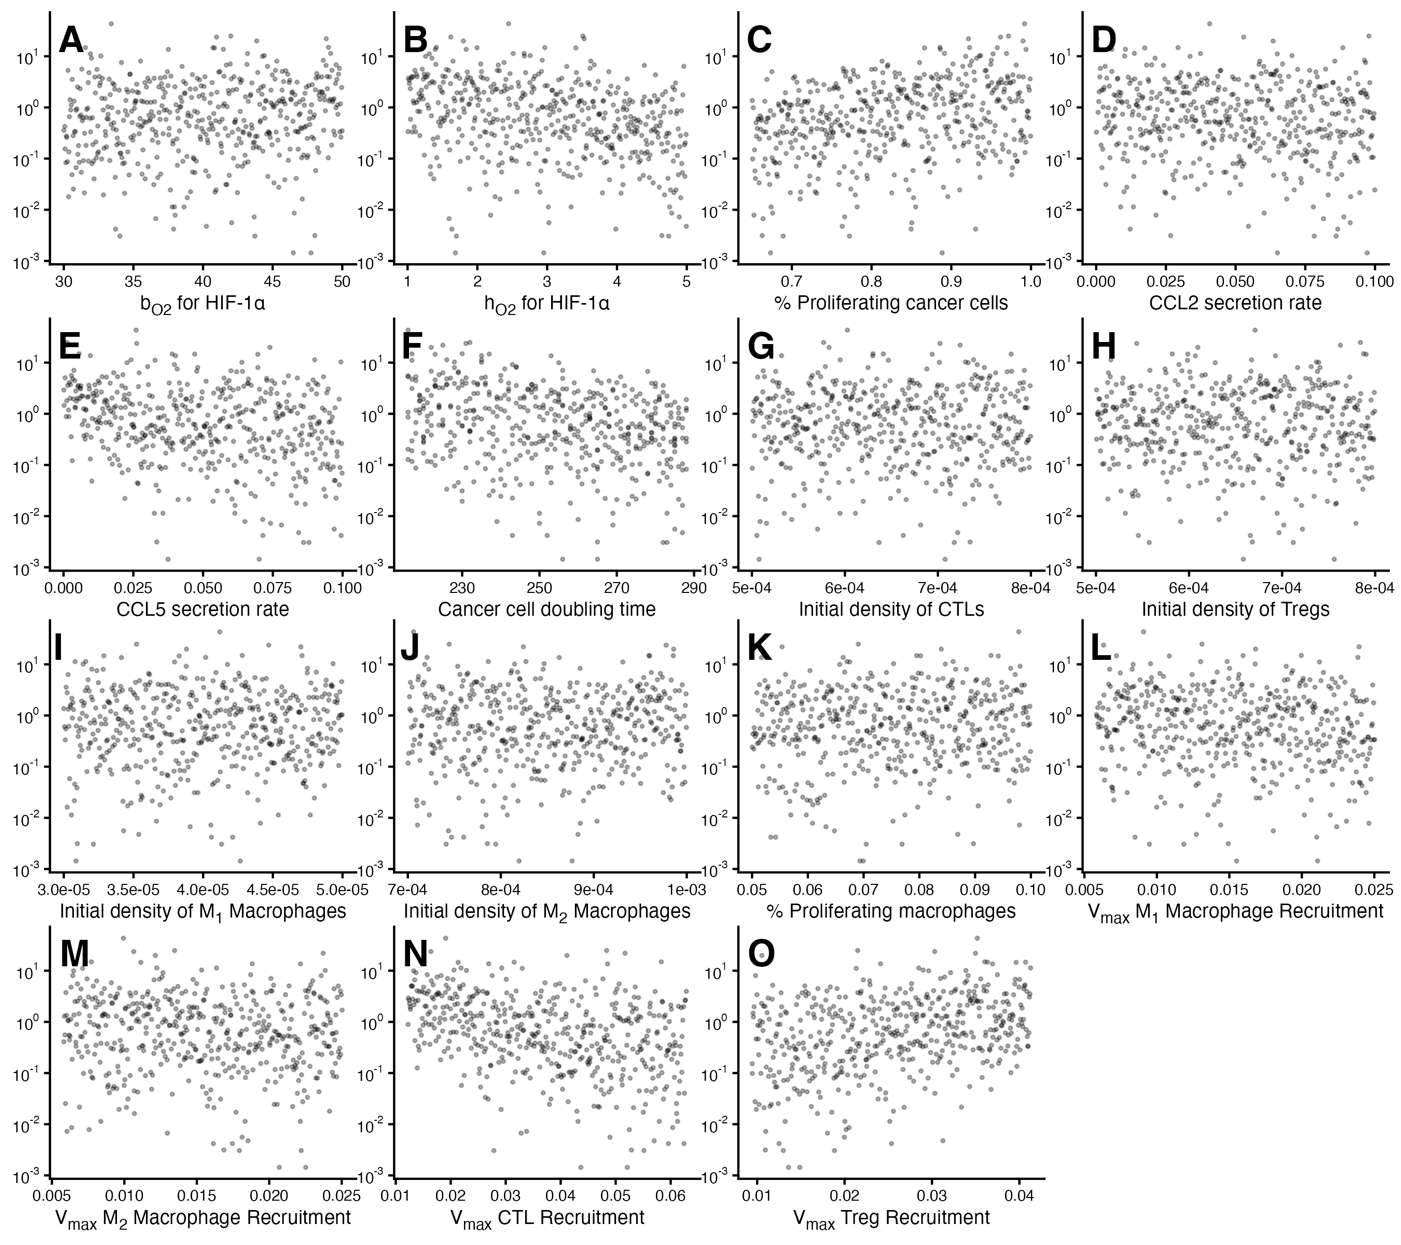 |
| Figure A: Scatter plots of virtual tumor volume by PRCC-significant parameter values. For each panel, the y-axis is simulated tumor volume in mm3. We add 10-3, which was below the minimum tumor volume, to plot on a logarithmic scale. Each point shows the average TumorSim value across three replicates simulations run with the same values for all model parameters. Values shown are measured at the simulation end-point, which is 14 days after the initiation of the escape phase. |
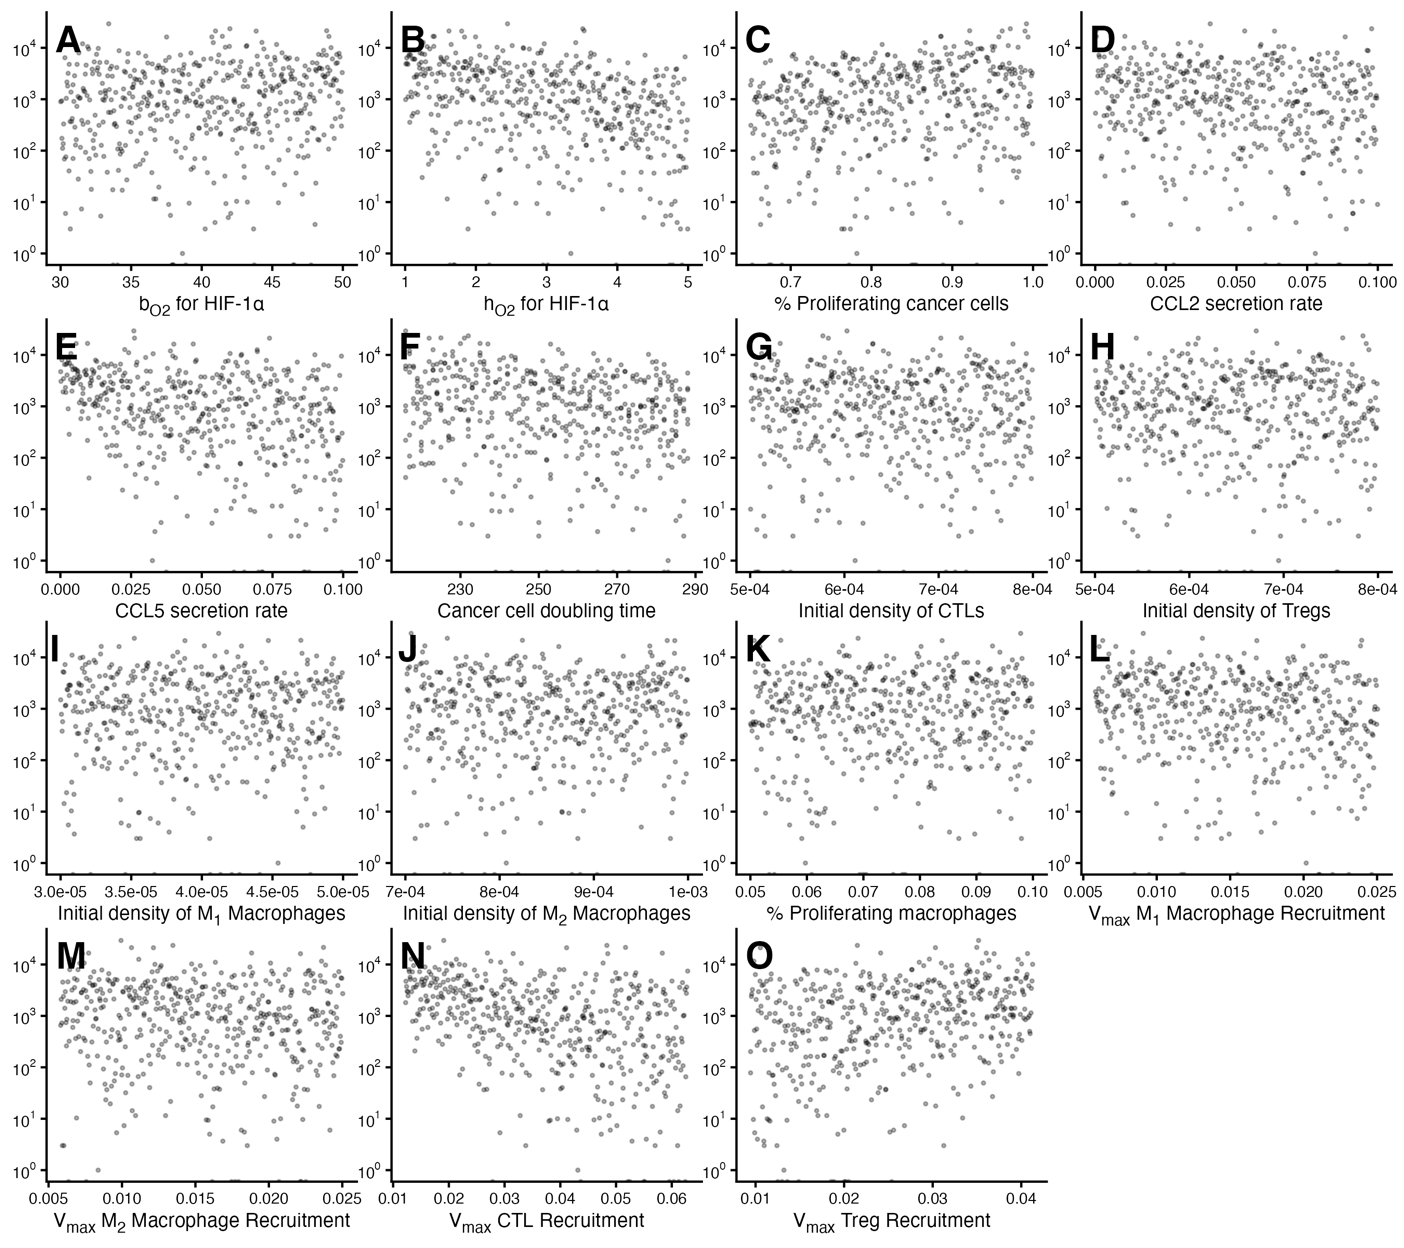 |
| Figure B: Scatter plots of virtual cancer cell count by PRCC-significant parameter values. For each panel, the y-axis is 1+(#cancer cells). We add 1 to plot on a logarithmic scale. Each point shows the average TumorSim value across three replicates simulations run with the same values for all model parameters. Values shown are measured at the simulation end-point, which is 14 days after the initiation of the escape phase. |
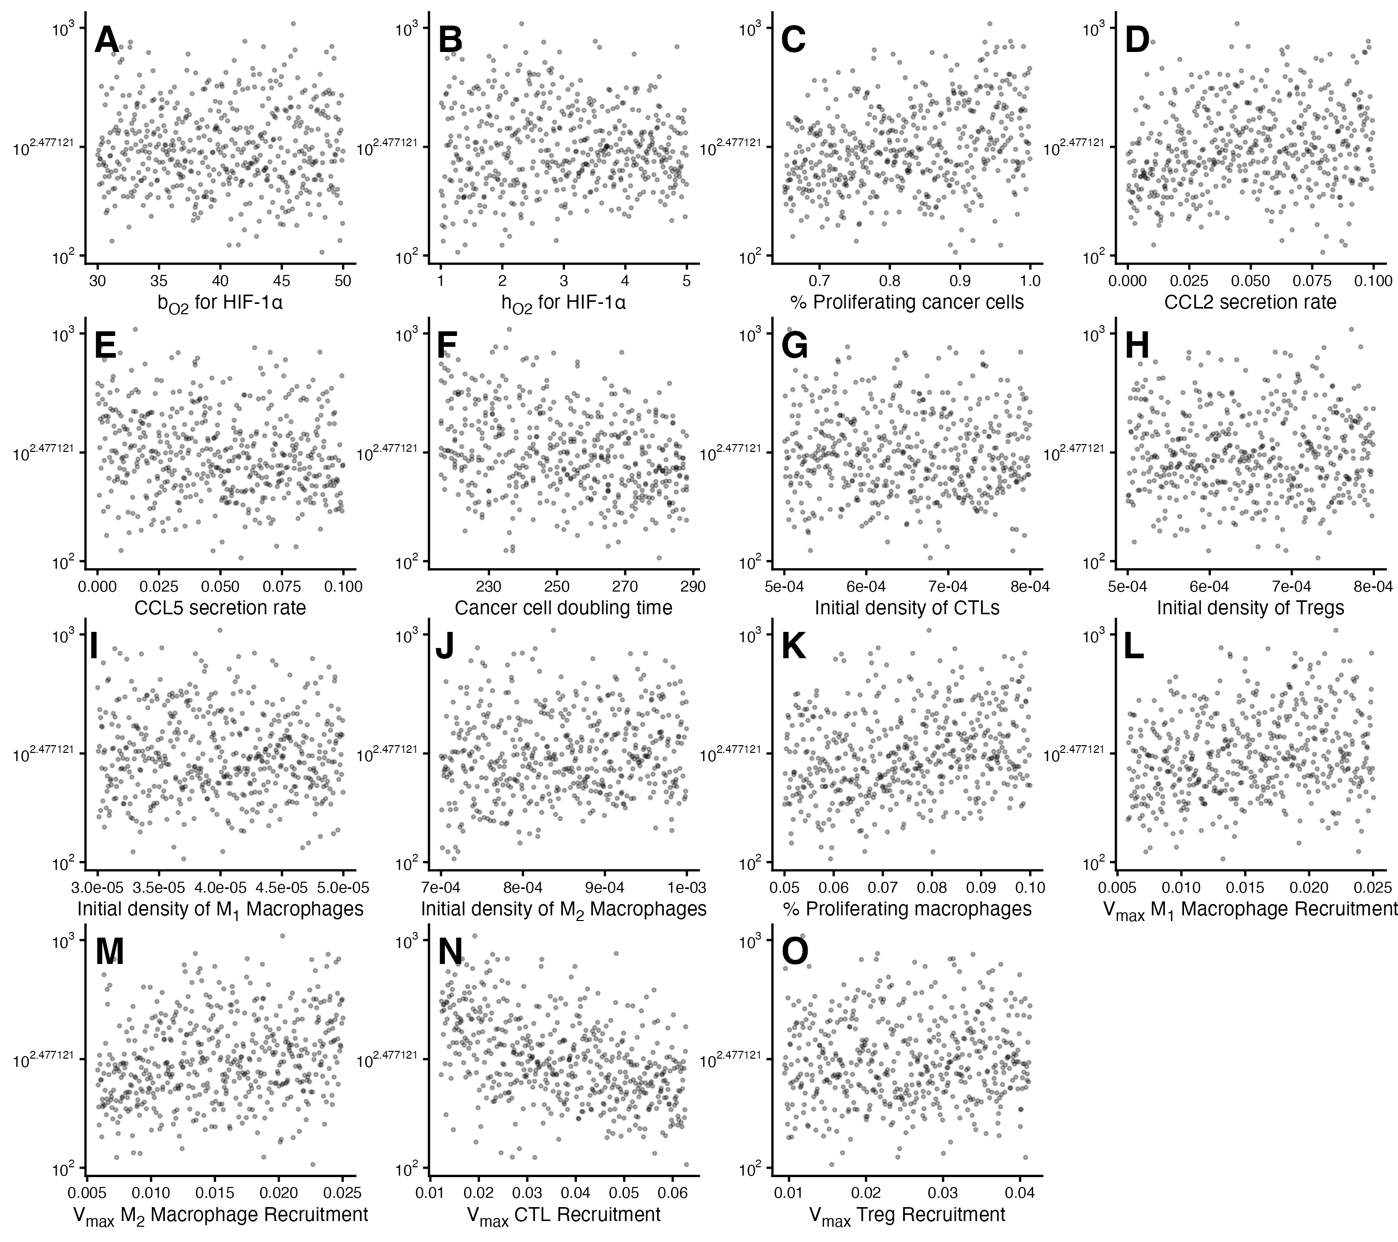 |
| Figure C: Scatter plots of virtual macrophage count by PRCC-significant parameter values. For each panel, the y-axis is 1+(#macrophages). We add 1 to plot on a logarithmic scale. Each point shows the average TumorSim value across three replicates simulations run with the same values for all model parameters. Values shown are measured at the simulation end-point, which is 14 days after the initiation of the escape phase. |
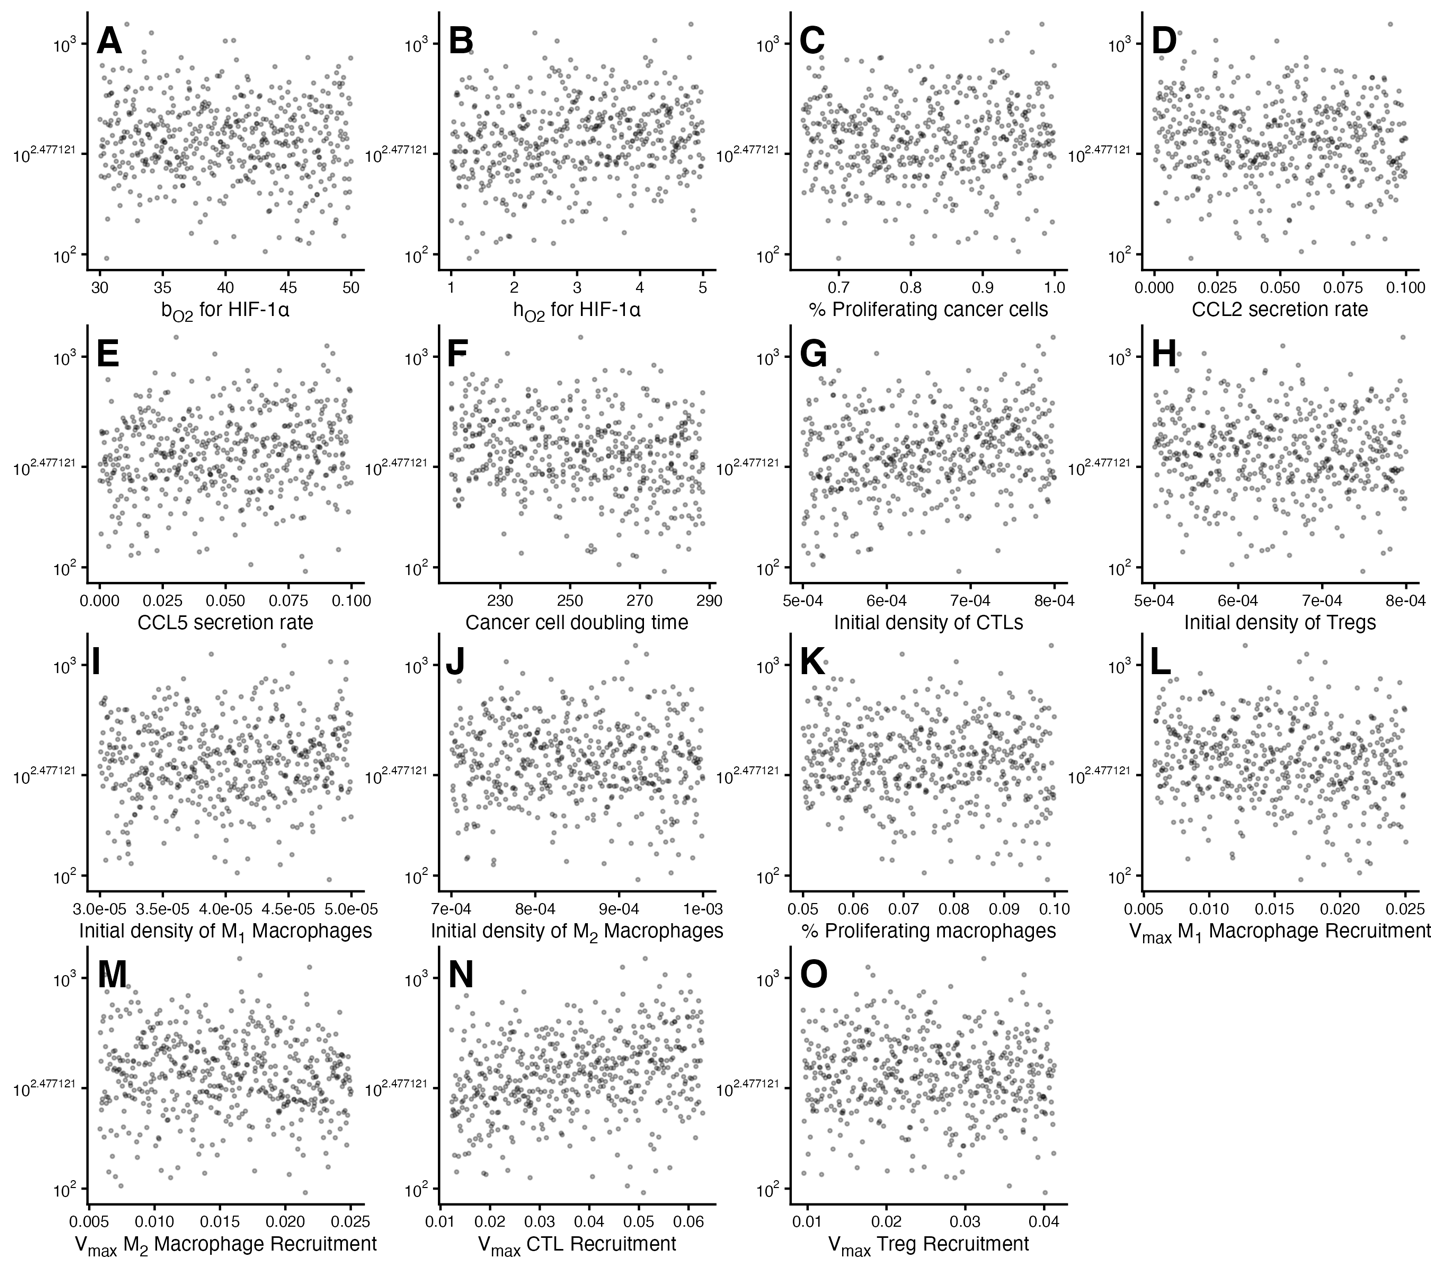 |
| Figure D: Scatter plots of virtual CTL count by PRCC-significant parameter values. For each panel, the y-axis is 1+(#CTLs). We add 1 to plot on a logarithmic scale. Each point shows the average TumorSim value across three replicates simulations run with the same values for all model parameters. Values shown are measured at the simulation end-point, which is 14 days after the initiation of the escape phase. |
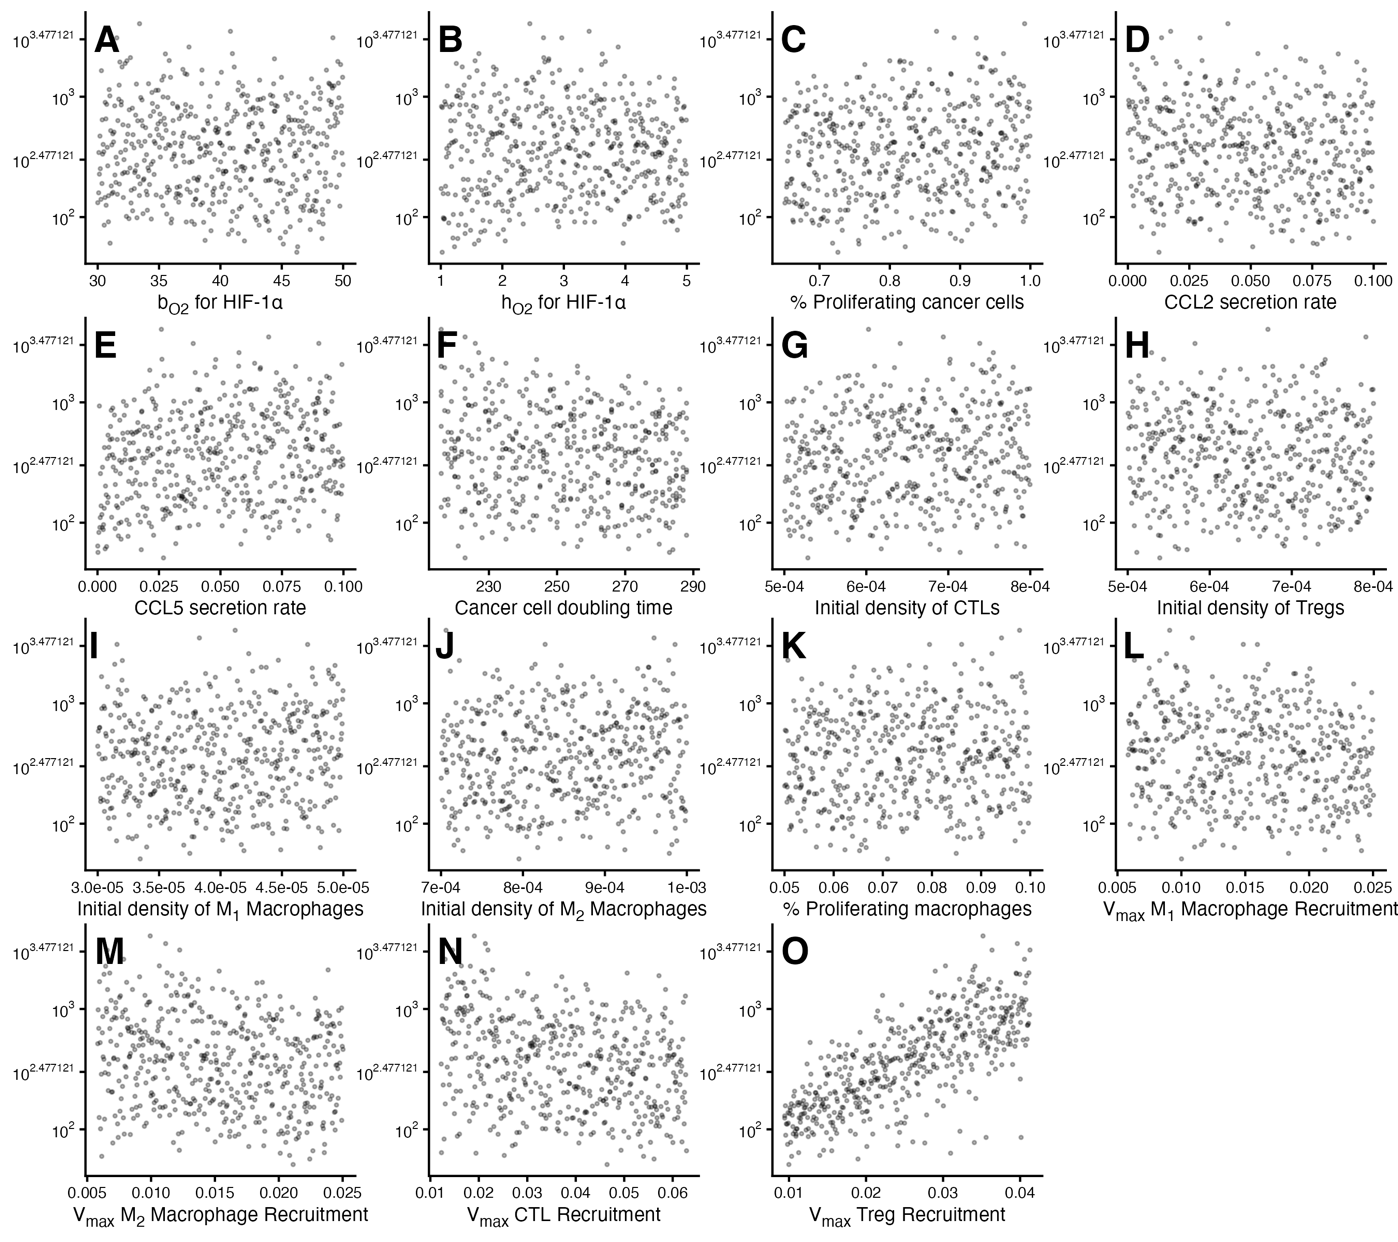 |
| Figure E: Scatter plots of virtual Treg count by PRCC-significant parameter values. For each panel, the y-axis is 1+(#macrophages). We add 1 to plot on a logarithmic scale. Each point shows the average TumorSim value across three replicates simulations run with the same values for all model parameters. Values shown are measured at the simulation end-point, which is 14 days after the initiation of the escape phase. |
| [ Kirschner Lab Time-Lapse Simulations Homepage ] |
|
All content and files © 2026 The Regents of the University of Michigan All rights reserved - Kirschner Lab: [ http://malthus.micro.med.umich.edu/lab ] |